
What are MDPhD’s Evidence-Based Medicine (EBM) Flashcards?
Clinical or biomedical research is slow translate to the bedside, yet critical for practicing evidence-based medicine.
Physicians face barriers when integrating published research into their daily decision analysis. Lack of time, cost of articles and information overload are reasons why this translational gap in medicine exists.
MDPhD helps physicians save time by transforming clinical abstracts into evidence-based medicine (EBM) flashcards. Our flashcards are colour coded and filled with data visualizations to help you consume information quick and easily.
Clinical abstracts are converted to EBM flashcards one day after publication on PubMed. The cards designed to help physicians consume research quickly; saving them time. The flashcards are colour coded by methodology and graphed with key insights.
Colour coding is based on the methodology or design used in the study.
– Clinical Practice (Reviews, Case Reports and Guidelines) are pink
– Diagnostic Trials are red
– Genetic Trials are purple
– Meta-Analysis are blue
– Observational Trials are yellow
– Randomized Control Trials are green


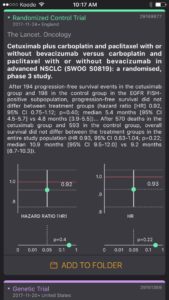
EBM flashcards are our versions of visual abstracts. Our EBM flashcards include relevant statistical outcomes such as point estimates, confidence intervals and p-values when available to give the user a quick summary of the results. The user can cross reference the graphs with the text in the card to quickly identify how the predictor is related to the response variable. The graphs also allow the user to appreciate the magnitude of the result, the width of the confidence interval and how far away the result is from the null hypothesis (red baseline).
Organize EBM flashcards into specific topic folders and quickly scan them for clinically significant results in a variety of clinical settings and studies. Focus on the big picture as you combine clinical trials with your clinical experience, expert opinion, psychological and biological mechanisms, resources and patient values to come up with clinical decisions.
We are constantly improving our algorithms and data visualizations to stay relevant and to help you consume information more easily. If you notice any errors or colour coding or data visualization, please help us by reporting it to us or contact support with your issue or to provide feedback.
Be Curious,
Dr. Sanjeev Singwi