
MDPhD Workflow: Quick Overview
Clinicians are expected to consume literature and translate knowledge from research to solutions that work in the real world. But in reality, that doesn’t happen; at least not in a timely way. This so called ‘translational gap’ refers to the disconnect between the development and implementation of new solutions in clinical practice.
Why does this gap exist? The reasons are complex, but it’s largely due to the overwhelming amount of information that clinicians are expected to consume and lack of time to consume them. The consequences of this can be alarming because patients are either being deprived of treatments or exposed to harms that have already been validated over 10 years ago.
MDPhD is designed for quick consumption of evidence. We help users look at the big picture and identify clinically reproducible results or trends over the years.
To give you a better idea of how the app works, let’s break down the MDPhD workflow by walking through a relevant topic.
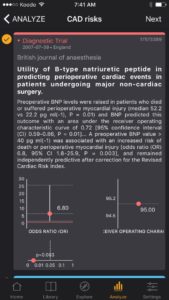
Is Preoperative B-Type Natriuretic Peptid (BNP) Useful?
Step 1.
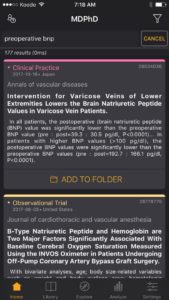
Go to the ‘Home’ tab and type in your query. You will have to experiment with different queries as this particular query yielded 177 results. You could also try a more general query like “bnp” and apply clinical filters like ‘Date’, and ‘Speciality’ to drill down your results. More on filters in Step 4. In general, type queries and tap filters to start the discovery phase.
Step 2.
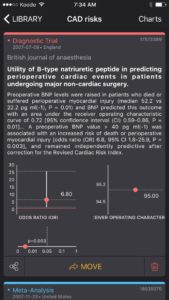
Browse the results quickly. The results you see are evidence based medicine summaries of clinical abstracts or ‘EBM flashcards‘. The results are ranked by relevance and cards are colour coded by methodology.
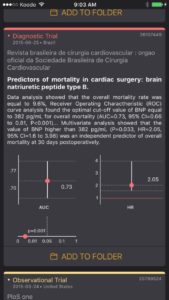
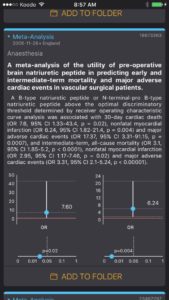
Statistical results of the study are displayed using data visualization to highlight the value of the point estimate and the confidence interval so the user can appreciate the statistical significance and the clinical significance of the result.


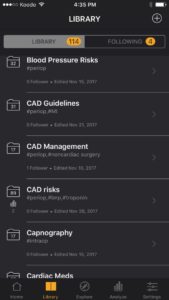
Step 3.
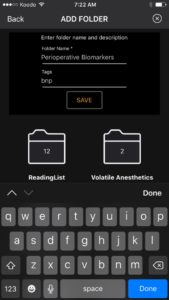
Create a folder in the ‘Library’ tab. Tap the plus button top right in the Library tab and name your folder. For example “BNP” or “Cardiac Risk”. You can also add descriptive tags to your folder like “anesthesia”, “periop”, “biomarkers”, “bnp”, “troponin” etc.
Begin populating your folder with relevant cards by tapping “Add to Folder”. There is also a default “Reading List” folder where you can add your cards into quickly. You can always organize your cards into folders later.
Step 4.
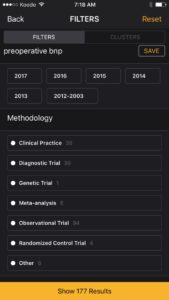
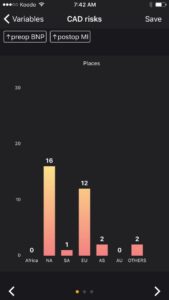
More on Filters. Most often it is better to start with a general query and drill down your results with our clinical ‘Filters’. Tap the filter icon (top right Home tab) and you will immediately appreciate the distribution of results of your query.
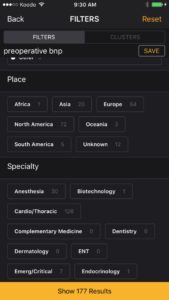
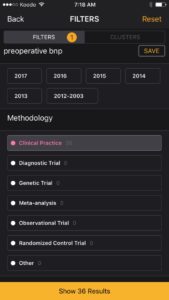
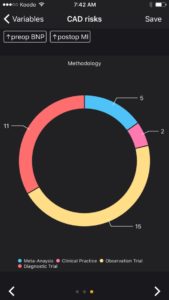
For example “preoperative bnp” is heavily weighted with ‘Observational Trials” and most studies are coming from “North America”. I often start with “Clinical Practice” and “2017” to get an updated intro on the topic.
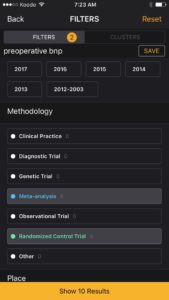
As I learn about the topic I refine my queries and start exploring. Then I will generally check out the “Meta-Analysis” and “Randomized Control Trial” filters. I will also check “Specialty” filters to get more relevant cards in my field. While you explore, continue to add cards to your folder.
Step 5.
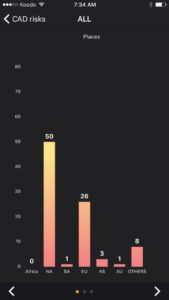
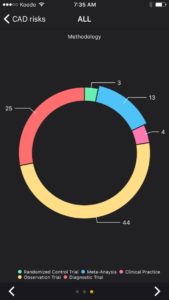
Review your results. The whole “Search-Filter-Add to Folder” workflow should take minutes. You don’t have to go overboard to appreciate the historical trends and relevant clinical outcomes of your query. To help you look at the big picture, tap on your folder and tap on the ‘Charts’ button (top right) and check out the data visualizations.
You will quickly see where the research is coming from, what journals it was published in and the distribution of research methodologies. The charts are interactive so tap on a bar or a slice! Your EBM folders can be updated and reviewed anytime.
Step 6.
Synthesize your results. As you start populating your folders you will notice trends in clinical outcomes. For example, after populating my folder, “CAD Risks”, I quickly noticed that there is over 10 years of research and several guidelines showing the prognostic value of preoperative bnp in various clinical settings with various clinical outcomes. Look for clinically significant patterns in your folders. There is no need for complex mathematical models, just a narrative review based on your clinical experience, expert opinion, biological mechanisms and trial data.
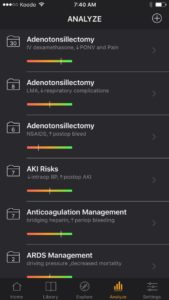
Go to the “Synthesize” tab, select your folder and select the cards which you want to synthesize. Then enter what you think is the primary predictor variable (i.e. “pre-op bnp”) and what you think is the primary response variable (i.e. “post-op MI”).
You can link multiple analytics to your folders with unique predictor-response relationships (like ‘pre-op bnp-post-op mortality’, ‘pre-op bnp-post-op MACE’ etc). The important point is to look for patterns of reproducible and clinically significant results over several studies rather than analysis-paralysis of a single study.

Several interactive graphs will help you visualize your synthesis.

Finally you are asked to rate the strength of the predictor-response relationship based on your experience, expertise, trial data and biological basis. This can be updated anytime with new evidence. Strong relationships today can become weak relationships tomorrow and vice versa.
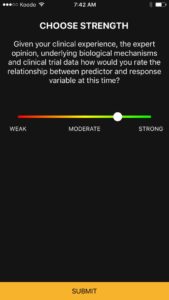
I rated the evidence on the ‘preop bnp and postop MI’ relationship as “strong” at this time. The only weakness I could identify was a paucity of RCTs on the topic right now. However, I can see enough of a signal in the research to incorporate preoperative bnp into my own practice while not seeing any real downside.
This is the workflow in MDPhD. The idea is to make evidence based medicine easy and quick to consume, to help identify reproducible patterns in clinical research and help transfer that knowledge to the bedside to benefit patients today. Clinical decision making should always incorporate patient values and resources.
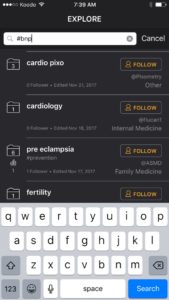
Explore Button
Just an aside about the Explore button. Every time you create a folder it is available for other users to add into there following list in the Library tab. So if you are interested in preoperative biomarkers feel free to follow my ‘CAD risks’ folder by searching it in the “Explore” tab. You can also search by username like @singwis or by hashtags like #bnp. As users start adding folders to the network other users can follow and participate in the collaborative network of MDPhDs. .
Try MDPhD Today
The idea is to make evidence based medicine easy and quick to consume, to help identify reproducible patterns in clinical research and help transfer that knowledge to the bedside to benefit patients today. Clinical decision making should always incorporate patient values and resources.
Be Curious!
Dr. Sanjeev Singwi