
Predictor-Response Relationships
All clinical studies can be distilled down to finding the relationship between predictor variables and response variables. I say relationship because, in general, causation is a difficult endeavour, especially in medicine where there is so much variability. Nevertheless, with the scientific method and some math researchers can, at the very least, quantify the relationship between variables.
In medicine, we study clinical variables. Variables can be further divided into predictor variables and response variables. Predictor variables can also be referred to as independent or experimental variables while response variables can also be referred to as dependent or outcome variables. When testing a hypothesis the researcher chooses which variables are predictor variables and which variables are response variables. More specifically, researchers are interested in how a few predictor variables are related to a few response variables in their study. For example, how DrugZ is related to stroke and mortality. A testable hypothesis must be well researched, state the predictor variable and state the response variable before collecting the data.
Many other clinically relevant variables are collected and measured in addition to the variables being tested in the hypothesis to mitigate confounding effects or noise. Clinical researchers are always challenged with separating signal from noise. Noise can be further reduced by experimental design such as controlled trials: one sample with a predictor variable and one sample without a predictor variable.
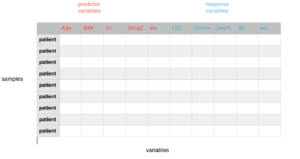
As patients enrol and data is collected a large data matrix is created with rows of patients and columns of variables. The researchers then use statistical tests to quantify the relationship between the predictor and response variables mentioned in the original hypothesis.
As consumers of research we usually do not have access to raw data. Moreover, we cannot be sure that all steps of the scientific method were implemented in sequence with the highest standard. Peer review helps to ensure high standards. Uploading the hypothesis, design and data to public registries is one of the best ways to ensure rigour, transparency and accountability. Fundamentally though, replicating clinically significant results across different settings by different researchers will give consumers of research the most confidence in the predictor-response results.
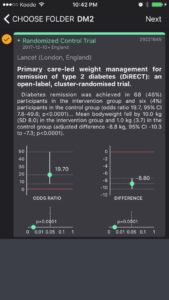
Lets use a recent study (see below) to quickly show how MDPhD helps the user consume the key evidence based medicine insights within minutes.
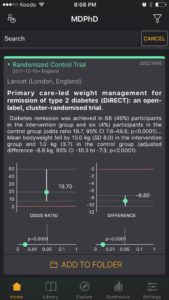
When looking at the MDPhD EBM flashcard (see below), the research design of the study is quickly identified by the colour coding. The primary predictor and response variables in the study appear in several places in the summary including the title, and text. The full abstract elaborates in the background and methods. In this case, the predictor variable is intensive weight management and the response variables are diabetes remission (HbA1C <6.5%) and weight loss (kg).
Two main results are highlighted in the EBM flashcard. The intervention group achieved diabetes remission with an odds ratio of 19.7 and mean bodyweight loss of 8.8 kg. Both point estimates come with a confidence interval. In both graphs, we can see that the CI does not cross the red baseline indicating statistical significance. In addition, the p-values for both results are well below 0.05. The magnitude of the results also give us a sense of the clinical significance. It is somewhat rare to see double digit odds ratios in clinical trials. If you have a patient similar to the ones studied here there is a very high probability that they will achieve remission of diabetes with this particular weight management program.
EBM Flashcard
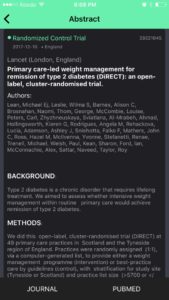
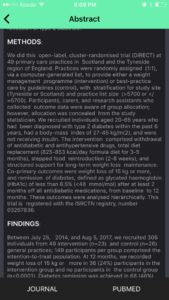
Full Abstract
The colour coding and data visualizations in the EBM flashcard and additional information in the abstract should allow the user to consume the most pertinent evidence based medicine insights from this study in less than a minute. This card can be added to a folder in the Library for future reference.
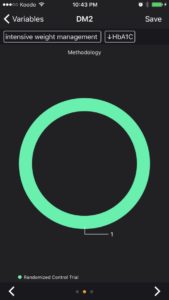
At this time, even though the user may have one card in their library folder for ‘DM2’, they can start a synthesis if they want to. Future studies that replicate these results can be added to the same folder as the health professional builds a case for changing their practice. This is a strong study with clinically significant results. The predictor variable is ‘intensive weight management’ and the response variable is ‘diabetes remission’ or ‘HbA1C’. I have started with a moderate strength of association between intensive weight loss management and decrease in HbA1C. This will change as more studies, more clinical experience and more expert opinions are available. Other users may rate the relationship differently right now.


Evidence-Based-Medicine is hardly ever analysis-paralysis of a single article. Always look at the big picture. Always update your evidence periodically. Strong associations today can become weak associations tomorrow and vice versa. Consider the expertise, biological mechanisms and the clinically reproducible results around a predictor-response relationship. Finally, when making clinical decisions, as always, incorporate patient values and resources.
Be Curious,
Dr. Sanjeev Singwi